Interactive experiments 2026
Next Moment
Draw the future. See what happens next.
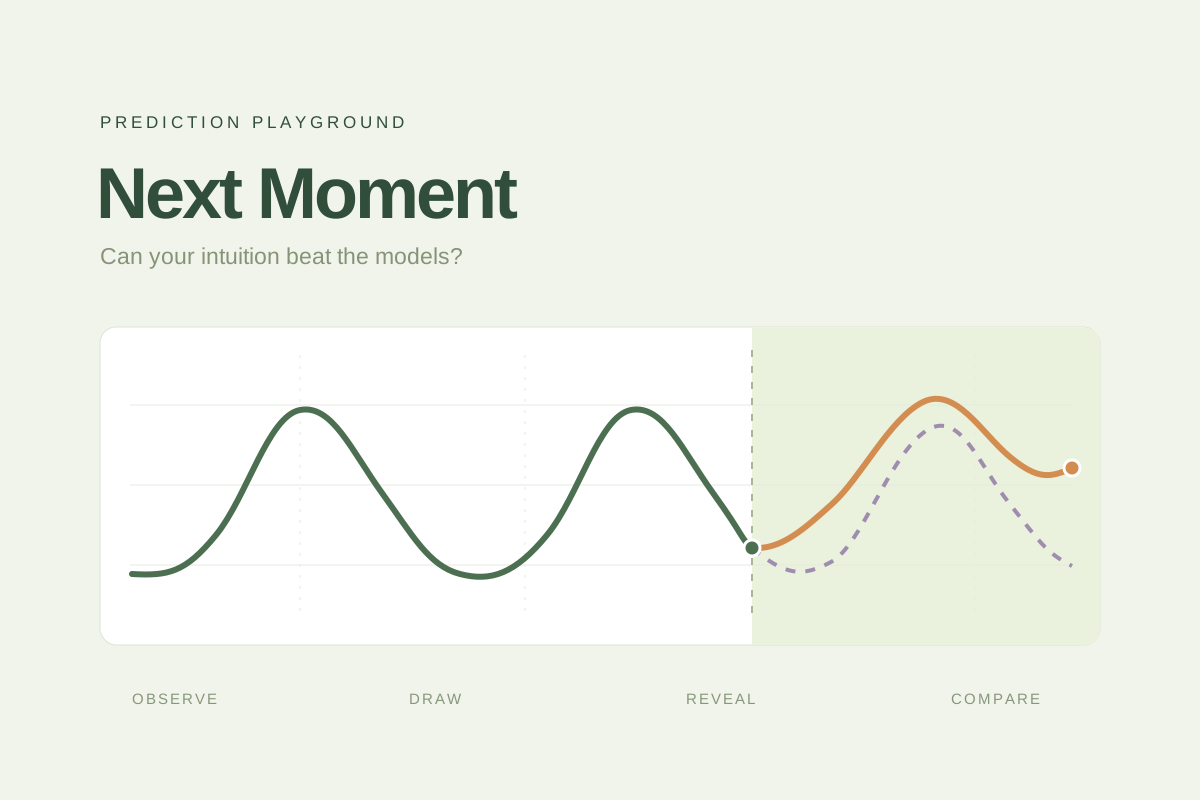
Why I made this
Forecasting starts with a simple question: what happens next? I wanted to turn that question into something you can play with. Draw your own answer before seeing the future, then find out which patterns helped and which surprised you.
How to play
- Look back. Read 48 hours of energy use and any clues about the day ahead.
- Draw forward. Use your mouse or finger to sketch the next 24 hours.
- Reveal. Watch the future appear and compare errors. Lower error wins.
Start with eight guided levels, from repeating daily patterns to changes in routine and weather. Timed clues help you think through each scenario. When you are ready, try 18 excerpts of real household electricity use.
The game opens in English, with a Chinese language switch.
Behind the curves
The guided levels are simulated scenarios. Their weather forecasts and household events are written clues, not live weather reports or observations from the real dataset.
The real-data challenges use excerpts from the UCI Individual Household Electric Power Consumption dataset. Three baselines offer different guesses: Last value, 6-hour average and Repeat yesterday. Each round compares these simple methods with your intuition.
Built with HTML, CSS and JavaScript, as a small experiment in time-series intuition and AI-assisted creative coding.